The Spend and Savings by Segment report provides a table view that summarizes spend and savings by country.
Note: For events, the country is set based on the optional Shipping Address. If a Shipping Address was not entered for an event, the event will be included in the blank country grouping.
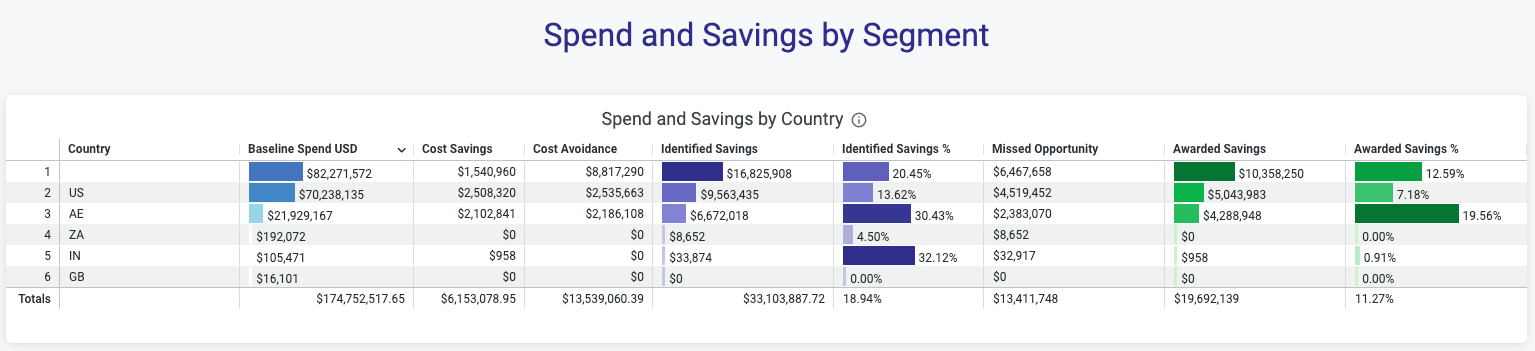
| Column | Description |
|---|---|
| Country | Displays the country assigned to the event. The country is assigned based on the Shipping Address selected for the event. Because Shipping Address is an optional field, it is possible for the Country to be blank (null). |
| Baseline Spend USD |
Displays your baseline spend on an item, service, category, or in general in Fairmarkit for a specified period of time. When a Benchmark value is provided, Baseline Spend will reflect the Benchmark value. The Benchmark value may be imported from or calculated based on values in your purchasing application or manually entered on an event. When a benchmark isn't provided, Baseline Spend will be calculated as the average of supplier responses, excluding any outliers. If you drill into this value, you can review and download a list of events included in the calculation. This includes a breakdown for each event, including the RFQ ID (with a link), Request ID, Status, Created at Date, Title, Baseline Spend USD, Cost Avoidance, and Cost Savings. |
| Cost Savings |
For awarded request for quote events, if the Benchmark is greater than 0, this value calculates as (Benchmark - minimum unit price awarded) * quantity. If a Benchmark was not entered, this value will be $0.00. If you drill into this value, you can review and download a list of events included in the calculation. This includes a breakdown for each event, including the RFQ ID (with a link), Request ID, Status, Created at Date, Title, Baseline Spend USD, Cost Avoidance, and Cost Savings. |
| Cost Avoidance |
For awarded request for quote events, if the Benchmark was not entered, this value is calculated as the average of bid unit prices - awarded bid unit price. If a Benchmark was entered, this value will be $0.00. If you drill into this value, you can review and download a list of events included in the calculation. This includes a breakdown for each event, including the RFQ ID (with a link), Request ID, Status, Created at Date, Title, Baseline Spend USD, Cost Avoidance, and Cost Savings. |
|
Identified Savings |
Displays the sum of identified, potential savings for your opened events. Identified savings is calculated at the line item level as Baseline - Lowest Bid. This value doesn't include alternative items. If you drill into this value, you can review and download a list of events included in the calculation. This includes a breakdown for each event, including the RFQ ID, Request ID, Status, Created at Date, Title, Identified Savings, and Awarded Savings. |
| Identified Savings % | Displays the percent of identified, potential savings for your events. This value is calculated as Identified Savings / Baseline Spend USD. |
| Missed Opportunity |
Displays the amount of missed opportunity. This value is calculated as Identified Savings - (Cost Savings + Cost Avoidance). |
|
Awarded Savings |
Displays the sum of awarded savings for your request for quote events. This value is calculated at the event level as baseline spend - awarded bid. This calculation only includes values where you saved money. |
| Awarded Savings % |
Displays the percent of awarded savings for your events. This value is calculated as Awarded Savings / Baseline Spend USD. |